
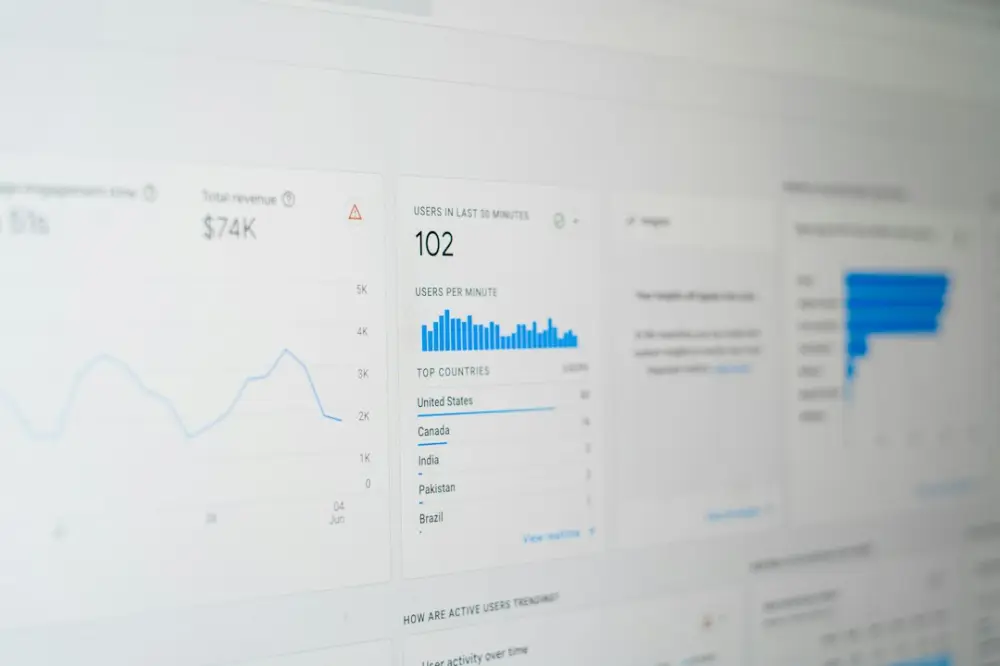
Articles in this Analysis practice guide
Performance analysis should clarify decisions. Too often, it does the opposite. In the fast-moving world of affiliate marketing and digital performance, teams frequently misread data, chase the wrong signals, and optimize in directions that look good on dashboards but hurt real outcomes. The discipline of Analysis practice is not about having the most data; it is about having the most clarity.
This hub serves as a comprehensive guide to mastering the discipline of performance analysis. By moving beyond the surface level of raw numbers, you can turn tracking data into reliable, actionable business decisions. We will explore the framework for interpretation, the necessity of context, and the common pitfalls that lead even experienced teams astray. The goal is to move from simply "tracking" to truly "analyzing."
The Fundamentals of Disciplined Performance Analysis
Analysis is the process of filtering noise to find signals. In modern performance marketing, the volume of noise is staggering. Every click, impression, and scroll depth is recorded, creating a mountain of data that can easily obscure the truth. Disciplined analysis starts with the understanding that data is not an end in itself; it is a map used to navigate toward a specific business result.
To practice analysis effectively, one must adopt a mindset of skepticism toward "good-looking" numbers. A 20% increase in traffic is meaningless if the conversion rate drops by 50%. A lower Cost Per Click (CPC) is a failure if the resulting traffic has zero intent to buy. Disciplined analysts look for the "why" behind the "what." They understand that a dashboard is just a collection of symptoms, and their job is to diagnose the underlying health of the campaign.
The first step in this discipline is acknowledging that not all data is created equal. You must separate the metrics that reflect the health of your business from those that merely reflect the volume of your activity. This requires a rigorous focus on outcomes over activities—a theme we will revisit throughout this guide.
Building a Framework for Clear Data Interpretation
Interpretation is where data becomes intelligence. Without a framework, interpretation is subjective and prone to bias. Most performance reports fail because they are built for visibility rather than decisions. They show what happened yesterday but offer no guidance on what to do tomorrow.
A robust interpretation framework begins with the outcome. Instead of opening a dashboard and looking for interesting spikes, you should start with a question: "What decision do I need to make today?" Whether you are deciding to scale a budget, cut a specific traffic source, or pivot a creative strategy, the question dictates which data points matter.
In this framework, you must learn to interpret performance data without. Complexity is the enemy of action. When a report includes thirty different data points with equal weighting, the primary signal is lost. Effective analysts prioritize metrics that influence action—such as Conversion Rate (CR), Cost Per Acquisition (CPA), and Return on Ad Spend (ROAS)—while treating others as secondary diagnostic tools.
Example: The Interpretation Logic
Imagine a campaign where traffic has doubled, but revenue has remained flat. A shallow interpretation might celebrate the traffic growth. A disciplined interpretation asks: "Where did this traffic come from, and why did it fail to convert?" By looking at the relationship between traffic source and conversion intent, you might find that a new broad-match keyword is driving high volume but low-quality users. The decision is then clear: tighten the targeting, even if it means the traffic numbers go back down.
Why Context Is the Bridge Between Data and Insight
Raw numbers are neutral; context gives them value. A conversion rate of 5% is fantastic for some industries and a disaster for others. It might be a record high for a cold-traffic campaign but a failure for a retargeting list. This is why data context matters more than raw numbers when making high-stakes decisions.
There are four primary layers of context that every analyst must apply to their data:
- Time Context: Is this a one-day spike or a three-week trend? Evaluating performance across trends rather than snapshots prevents overreaction to short-term fluctuations.
- Channel Context: Comparing the performance of a high-intent search ad to a low-intent social media interruption ad without context leads to poor optimization. They serve different roles in the funnel.
- Audience Context: High engagement from a low-intent audience is not the same as lower engagement from a high-intent audience. You must know who is clicking to know what the click is worth.
- Competitive/Market Context: External factors like seasonal shifts, holidays, or competitor aggressive pricing can shift your numbers regardless of your internal campaign quality.
Without these references, data is easy to misread. Context turns numbers into signals by answering the critical question: "Compared to what?"
Avoiding Common Pitfalls in Performance Reporting
Even with the best intentions, teams often fall into traps that lead to "false optimization." These are scenarios where you improve a metric that doesn't actually improve the business. To maintain a high standard of analysis, you must actively work to identify common performance analysis mistakes and how.
One of the most frequent mistakes is optimizing for vanity metrics. These are numbers like impressions, clicks, or social likes that look impressive on a slide deck but have no direct correlation to revenue. If a metric doesn't change your behavior or inform a decision, it is decoration, not data.
Another pitfall is analyzing metrics in isolation. Performance exists in an ecosystem. If you only look at CPA without looking at the Lifetime Value (LTV) of the customers being acquired, you might cut your most profitable channels simply because they have a higher initial acquisition cost. Disciplined analysis requires looking at the relationship between metrics—understanding how a change in one variable ripples through the rest of the funnel.
The Correlation vs. Causation Trap
Just because two metrics move together doesn't mean one caused the other. A spike in conversions might happen at the same time you changed a button color, but if that spike also coincided with a national holiday or a competitor’s site going down, attributing the success to the button color leads to a false optimization strategy. Always look for the third variable.
Simplifying Complex Metrics into Actionable Signals
The hallmark of a master analyst is the ability to take a complex set of data and boil it down to a single, actionable insight. This is done by creating a hierarchy of metrics. At the top are your Primary KPIs—the one or two numbers that define success (e.g., Net Profit or ROAS). Below those are Diagnostic Metrics—numbers that explain why the KPIs are moving (e.g., Click-Through Rate, Landing Page Load Time, or Abandoned Cart Rate).
When reporting, focus on the signals that drive decisions. A report should not be a data dump; it should be a narrative of questions and answers:
- The Observation: "Our CPA on Channel X has increased by 15% over the last week."
- The Investigation: "Diagnostic metrics show that while CTR remains stable, the conversion rate on the mobile landing page has dropped."
- The Action: "We found a technical bug in the mobile checkout flow. We are reverting the recent update to restore performance."
This approach moves the team away from "monitoring" and toward "solving." By simplifying the data into these signals, you ensure that everyone—from the media buyer to the stakeholder—understands what the data is telling them to do next.
From Analysis to Optimization: Closing the Performance Loop
Analysis is a sterile exercise if it doesn't lead to optimization. The "Performance Loop" is the continuous cycle of tracking, analyzing, deciding, and acting. The speed and accuracy of this loop determine your competitive advantage.
To close the loop effectively, you must establish a threshold for action. For example, you might decide that no changes will be made to a campaign until it has reached a statistically significant number of conversions, or that a 10% fluctuation in daily spend is acceptable "noise" that doesn't require intervention. These rules prevent the "over-optimization" that occurs when teams react too quickly to short-term data spikes.
Optimization should be systematic. Once an analysis reveals a potential improvement, implement the change and immediately set a new benchmark. The goal is to create a compounding effect where each small insight leads to a slightly more efficient campaign, eventually resulting in significant growth that competitors—who are likely still chasing vanity metrics—cannot replicate.
The Affhit Approach to Analysis Practice
At Affhit, we believe that performance analysis is a competitive discipline. The difference between a profitable affiliate and one who struggles often comes down to how they handle their tracking data. We don't just look at the numbers; we interrogate them. We look for the context that others ignore and avoid the vanity metrics that others celebrate.
Mastering Analysis practice means developing the discipline to ignore 90% of the data in favor of the 10% that actually moves the needle. It means being willing to admit when the data proves your hypothesis wrong. Most importantly, it means turning every piece of tracking data into a clear, actionable step forward.
Further Reading & Supporting Resources
To deepen your understanding of these principles, explore our detailed guides on the specific mechanics of performance analysis:
- common performance analysis mistakes and how: A deep dive into the psychological and technical traps that lead to poor optimization decisions.
- interpret performance data without: Practical strategies for simplifying your reporting and focusing on the signals that influence action.
- data context matters more than raw: A guide to adding the necessary layers of perspective to your data to ensure your conclusions are accurate.